Is Retail DeFi Dead? Part 1
An onchain look at total value locked, capital concentration, and what holder data can and cannot tell us about who is actually left in DeFi.
Executive summary
This report tests a simple claim: that DeFi ownership data, which often shows a small number of addresses holding most of the supply, means retail participants have left the market. We study three systems and their receipt tokens using holder snapshots, balance bucketing, and a diagnostic for aggregator or custodian behavior based on interaction diversity.
- Solstice (Solana). We measure distribution for eUSX, the vault receipt token, and USX, the base stable unit, and show why USX concentration can be structurally inflated by vault custody balances while eUSX is the cleaner lens on vault exposure.
- Ethena (Ethereum). We analyze sUSDe distribution and address type composition, finding extreme concentration at the address level and a top holder set dominated by contract accounts rather than individual wallets.
- Aave v3 (Ethereum). We analyze aEthUSDT, aEthUSDC, and aEthDAI ownership and find that concentration differs materially by asset even within a single protocol.
The central finding across all three protocols: address level concentration does not, on its own, tell you that end user concentration is equally extreme. Custodians and aggregators can pool many individual users into a small set of operational addresses, and the data is more consistent with retail being intermediated than with retail being absent.
Introduction
DeFi has matured from a niche experiment into a layered financial stack. Stablecoins and yield bearing wrappers now function as settlement assets, collateral, and cash management tools across lending markets, vaults, and derivatives venues.
At the same time, the user experience has become increasingly intermediated. Many participants access DeFi through aggregators, centralized exchanges, brokers, routing contracts, and strategy vaults rather than interacting directly from a single self custody wallet. This structural shift changes how onchain ownership should be interpreted.
A common narrative holds that retail participation has faded because token ownership often appears extremely concentrated: onchain snapshots frequently show a small number of addresses holding a large share of circulating supply. The question motivating this research is simple. When onchain data shows that a few addresses dominate supply, does that mean retail is absent? In practice, the answer is not necessarily. Concentration can arise mechanically when user funds accumulate inside custody contracts or vault infrastructure, even if the underlying user base is broad.
This report studies three systems across Solana and Ethereum and focuses on the ownership distribution of both base tokens and receipt tokens. A base token is the transferable unit of account in a protocol. A receipt token is minted when users deposit into a vault or staking mechanism and represents the user's claim on the underlying pool. Because receipt tokens encode exposure while base tokens can accumulate at custody addresses, a recurring theme in this report is that base token holder distributions can look concentrated when assets sit inside vault contracts, while receipt token distributions describe more directly how exposure is actually spread across participants.
Our approach is a point in time snapshot methodology. For each protocol, we retrieve onchain holder balances, aggregate ownership at the wallet level where relevant, bucket balances into interpretable ranges, and compute supply share contributions. We also apply an aggregator diagnostic designed to distinguish single entity whales from pooled operational wallets. On Solana, we use interaction diversity, proxied by the number of unique transaction fee payers touching a large holder over a fixed window of recent transactions. On Ethereum, we use inbound counterparty diversity, proxied by the number of unique senders transferring into a holder over a sampled transfers window. Neither diagnostic offers definitive attribution, but both help interpret whether a large holder behaves like custody or routing infrastructure rather than a single whale.
A note on terms
Three terms recur throughout this report and are easy to confuse for systems that wrap an underlying asset into a receipt token.
- TVL. Total value locked: the value of assets managed by a protocol or vault at a given time.
- Supply. The number of token units outstanding for a given token contract or mint.
- Backing. The value of underlying assets held against a receipt token. A receipt token's supply can be far smaller than protocol TVL if the protocol spans multiple products, or close to backing if it represents a single vault.
Assumptions and limits
This is a point in time onchain ownership analysis across Solana and Ethereum. The results describe concentration and distribution at the address level. They are not a direct census of end users, and several structural limits shape how the results should be read.
Snapshot and data integrity
- For Ethereum, holder enumeration, decimals, and total supply are evaluated at a single pinned block height. For Solana, mint supply and the token account scan are treated as one consistent state.
- RPC and indexer endpoints are assumed to return a complete set of token accounts or holders within the snapshot definition. Partial results would bias concentration and wallet counts.
- Where the sum of enumerated holder balances does not match total supply, absolute shares should be read alongside the reported reconciliation gap.
Identity and address interpretation
- An address is not a user. A single address can represent many end users through custody or aggregation, and one user can control many addresses.
- Aggregating Solana token accounts by owner reduces token account duplication but does not resolve multi wallet usage by a single entity.
- On Ethereum, checking an address's bytecode distinguishes wallets from contracts but does not identify the economic entity behind that address.
- Receipt tokens may be transferable, so current exposure is not identical to original depositor identity.
- No address labels were used in this study, so custody attribution throughout is probabilistic rather than confirmed.
Aggregator diagnostics
On Solana, we use the number of unique fee payers over the most recent 200 transactions as an interaction diversity proxy. On Ethereum, we use the number of unique inbound senders over a capped set of transfers as an inbound counterparty diversity proxy. Because both metrics depend on window and sampling, they should be read as indicative rather than as a standardized measurement across every address.
Solstice
Solstice is a DeFi protocol on Solana built around a dollar denominated stablecoin system and yield products.
The protocol issues a stable unit, USX, and offers vault style mechanisms that let users convert deposited stable assets into yield bearing positions. Protocol dashboards typically report TVL, USX total supply, and vault specific supplies and backing together, describing how much collateral the system manages and how that value is spread across products and token representations.
USX and eUSX
USX is Solstice's base stablecoin unit, the token users hold, transfer, and use across the ecosystem. Protocol level metrics such as TVL and total supply are typically expressed in USX terms because they reflect the total underlying stablecoin value the system manages.
eUSX is the vault receipt or share token tied to the Solstice yield vault. When a user deposits the underlying asset into the yield vault, they receive eUSX. Yield generally accrues inside the vault, so the value of one eUSX in USX terms can rise over time. A snapshot of eUSX holders lets us estimate how many wallets currently have exposure to the yield vault and how that value is spread across them. Because this is a holder based snapshot, it reflects current ownership rather than original deposit sizes where transfers are possible.
| Token | Price (USD) | Price (USX) | Supply | Backing |
|---|---|---|---|---|
| USX | 1.0000 | 1.0000 | 303,000,000 | 303.00m |
| eUSX | 1.0212 | 1.0212 | 110,630,000 | 112.98m |
Token price, supply, and backing snapshot, data from January 2026.
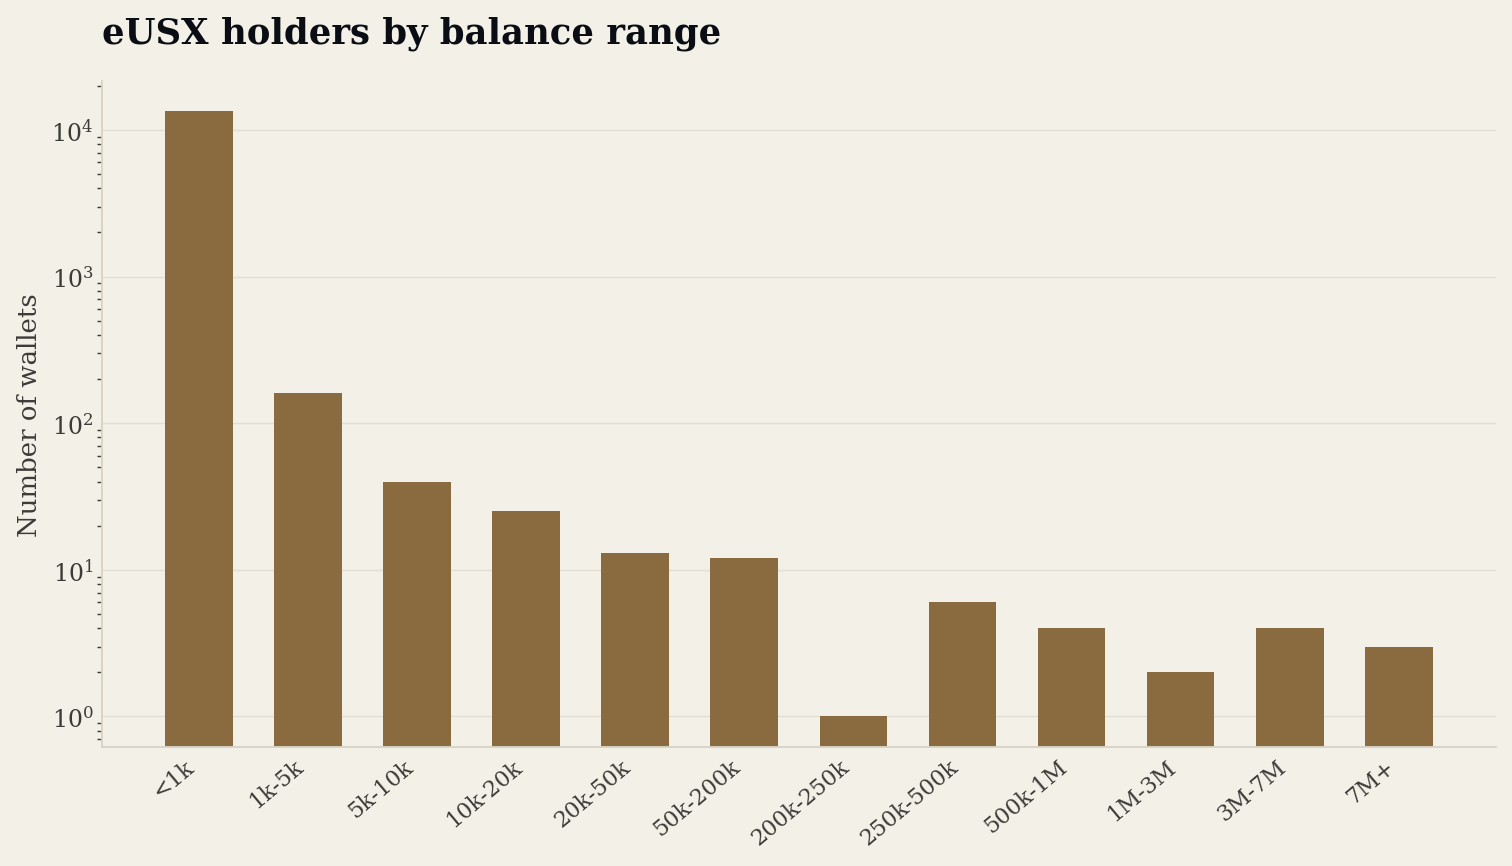
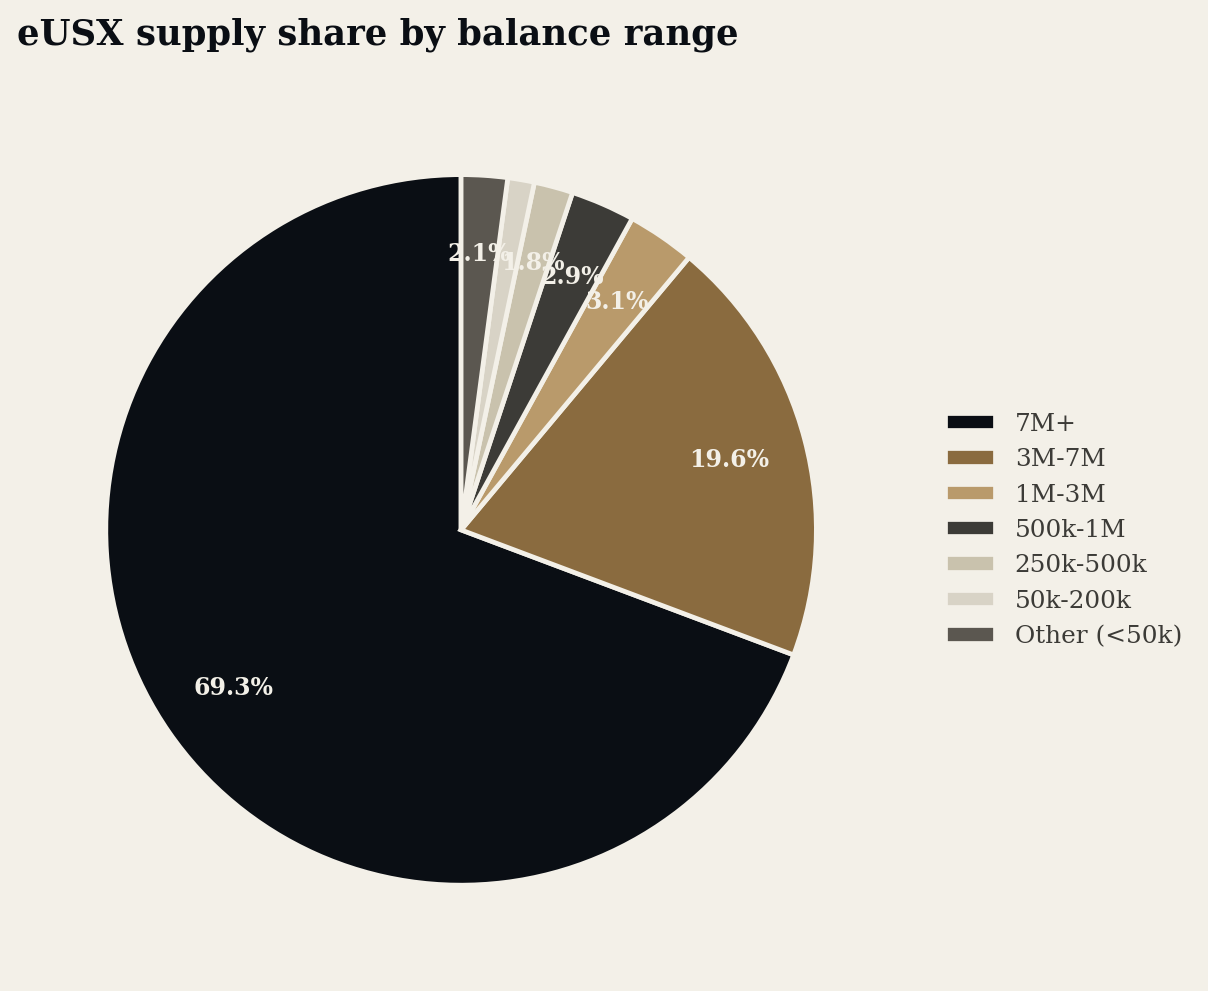
eUSX distribution by balance range
| Range | Share of supply | Wallets |
|---|---|---|
| Under 1k | 0.58% | 13,455 |
| 1k to 5k | 0.31% | 161 |
| 5k to 10k | 0.31% | 40 |
| 10k to 20k | 0.33% | 25 |
| 20k to 50k | 0.38% | 13 |
| 50k to 200k | 1.21% | 12 |
| 200k to 250k | 0.19% | 1 |
| 250k to 500k | 1.77% | 6 |
| 500k to 1M | 2.92% | 4 |
| 1M to 3M | 3.09% | 2 |
| 3M to 7M | 19.64% | 4 |
| 7M and up | 69.29% | 3 |
Just three wallets hold 69.29 percent of circulating eUSX, and only nine wallets combined hold nearly 95 percent of the vault's supply. At the same time, 13,455 wallets, the overwhelming majority of all eUSX holders, sit below the 1,000 token mark and together hold barely half a percent of supply. Total circulating eUSX supply at snapshot was 110,626,761.
USX distribution by balance range
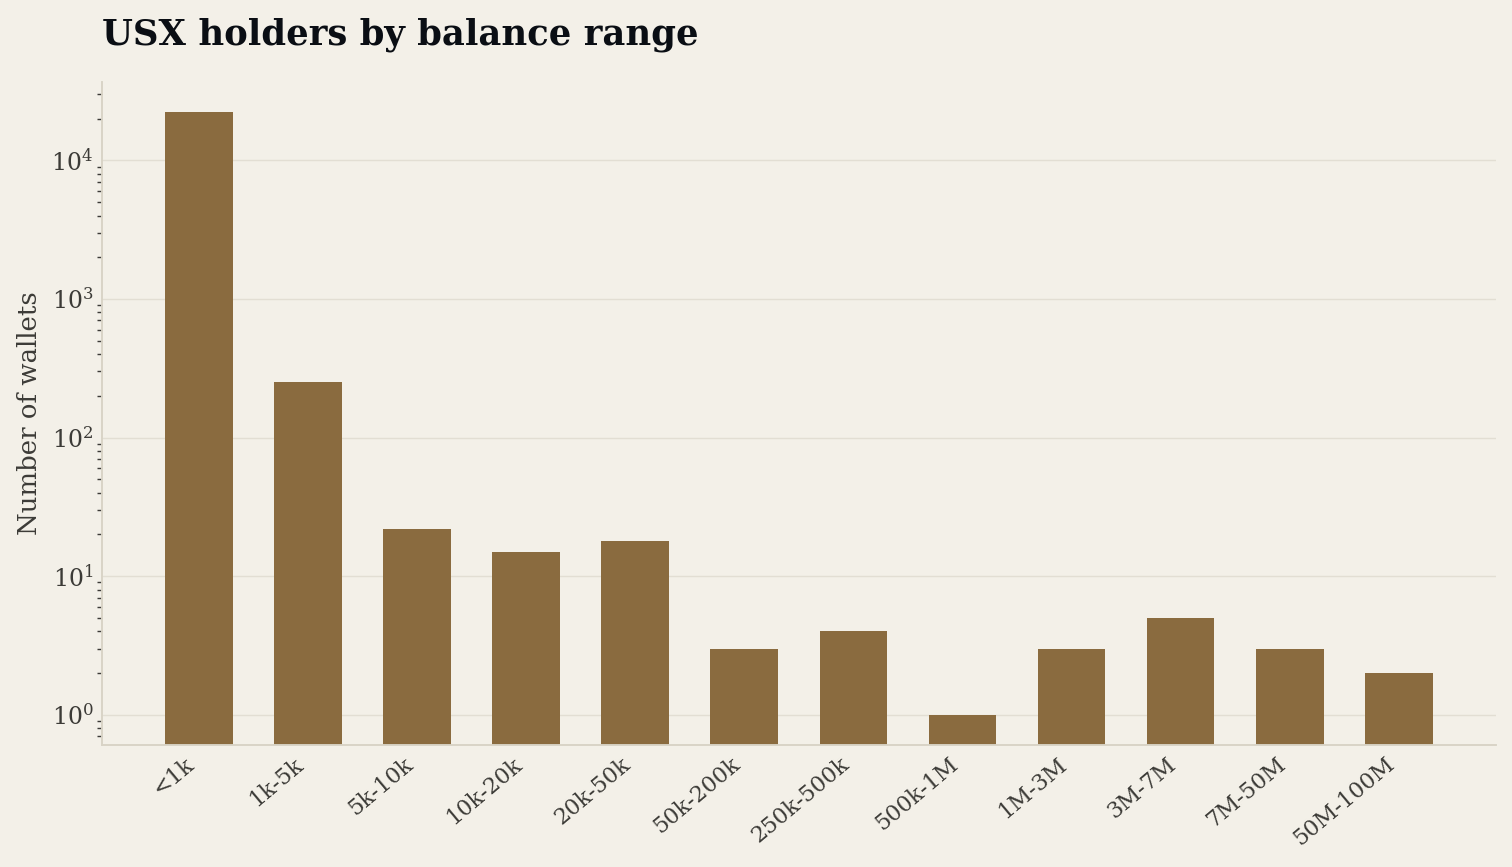
Why USX looks more concentrated than eUSX. eUSX is minted when users lock USX into the yield vault, and eUSX represents a share of the vault's net asset value. That means the USX backing eUSX sits inside one or more vault custody token accounts. Those custody accounts are themselves USX holders onchain, so they show up as very large USX holders in the distribution below, inflating apparent concentration relative to eUSX.
| Range | Share of supply | Wallets |
|---|---|---|
| Under 1k | 0.36% | 22,359 |
| 1k to 5k | 0.15% | 251 |
| 250k to 500k | 0.47% | 4 |
| 500k to 1M | 0.21% | 1 |
| 1M to 3M | 1.35% | 3 |
| 3M to 7M | 8.23% | 5 |
| 7M to 50M | 18.04% | 3 |
| 50M to 100M | 33.50% | 2 |
Ranges with negligible share (under 0.1 percent) omitted for readability. Total circulating USX supply at snapshot was 302,852,768.
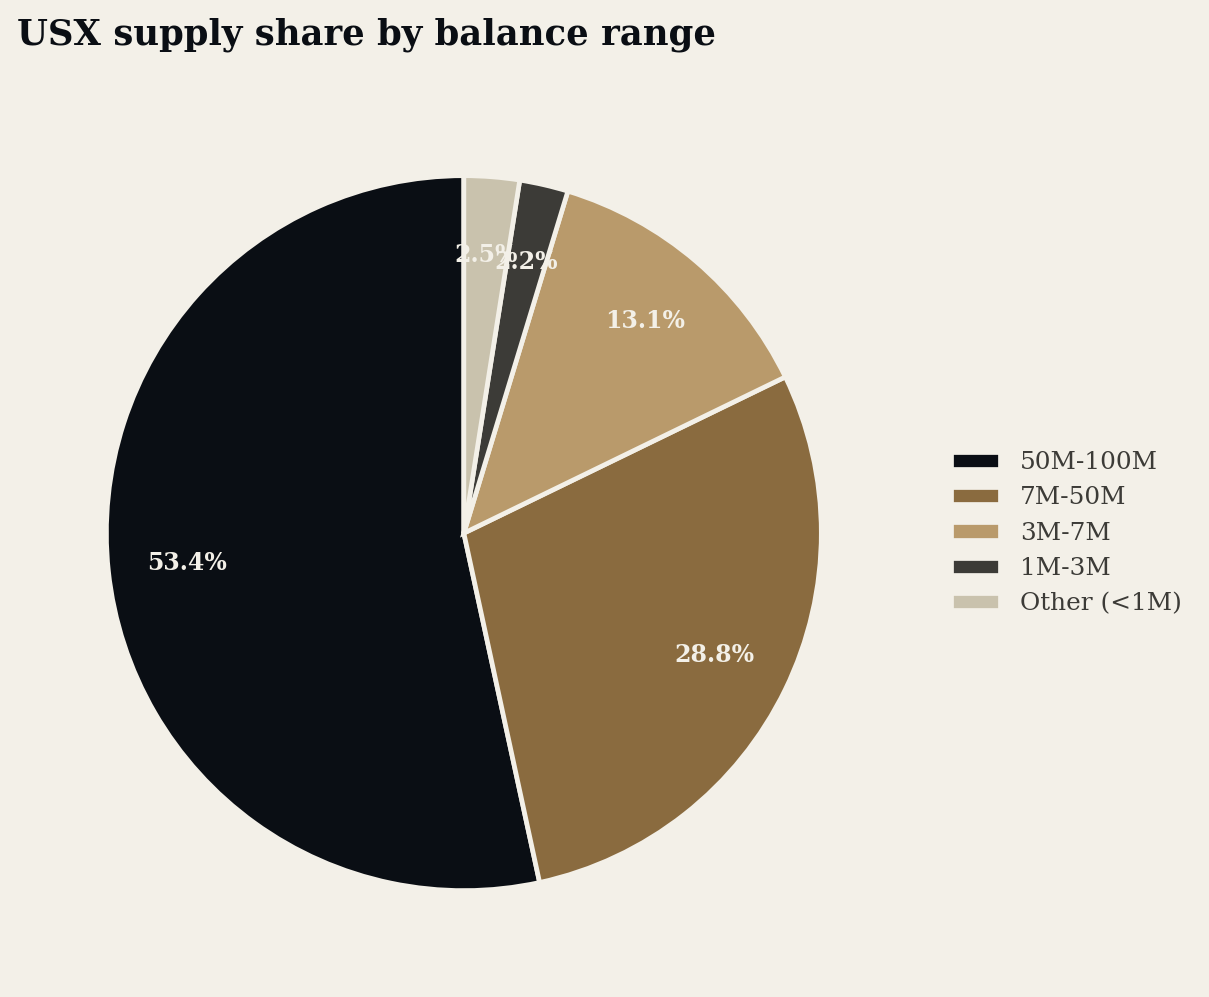
Note: the original source pairs a table and a chart for USX supply share that do not fully agree with each other (the chart's 50M to 100M share is 53.4 percent, the table's is 33.50 percent). The chart above matches the source figure, since its numbers sum to 100 percent; the table above matches the source table.
The aggregator hypothesis
A common pitfall when interpreting token holder distributions is to equate a small number of very large onchain holders with a lack of retail participation. In practice, large holders can represent custodial or routing entities that pool many users' funds into a small set of operational wallets. We tested this aggregator hypothesis for the largest USX holder using two complementary measurements: a balance snapshot aggregated at the owner level, and an interaction diversity test that counts unique transaction fee payers touching the address over its most recent 200 transactions.
A protocol custody address typically shows low signer diversity, while an aggregator or custodial wallet used by many clients tends to be touched by many distinct signing wallets over time. The largest USX holding wallet exhibits high interaction diversity: 129 unique fee payers over the most recent 200 transactions, while holding 33.5 million USX, or 11.12 percent of circulating supply. This is a strong indicator that the address is not driven by a single depositor's activity pattern, but is instead consistent with an aggregator or custodial hot wallet servicing many independent signers. It does not, on its own, prove the address is retail facing, since some fee payers could be bots, other protocols, or operational wallets; but it does mean concentration at this address should not be read mechanically as whale dominance.
| Rank | Owner | USX held | Is program |
|---|---|---|---|
| 1 | 2aHdm37...5hMiA | 122,320,946.81 | False |
| 2 | xaMJ2AT...5hMiA | 63,118,674.19 | False |
| 3 | 2WpAVkG...RRTLt | 34,022,988.50 | False |
| 4 | B4uWrVu...Qnv9w | 29,770,114.95 | False |
| 5 | 2e3WeM4...dfrYbix | 10,177,101.25 | False |
Top USX holders, owner aggregated. Addresses truncated for display. None of the top five holders are executable program accounts, meaning they are standard wallet addresses rather than onchain programs, consistent with either large custodial and aggregator wallets or a small number of large whales.
Ethena
Ethena is a synthetic dollar protocol on Ethereum that issues USDe and offers a yield bearing staking product through sUSDe.
USDe is an ERC20 token on Ethereum mainnet. Staking USDe routes it into a vault style smart contract implementing the ERC4626 tokenized vault standard, which mints sUSDe shares to the depositor. Ethena's documentation also notes that the staking contract includes a legally required ability to freeze funds for sanctioned addresses.
As with Solstice, USDe can become concentrated at protocol and custody contracts due to staking and routing flows, so USDe holder concentration can overstate whale style concentration of end users. Because sUSDe represents the actual yield bearing position, we prioritize sUSDe ownership as the more direct object for measuring how staked exposure is distributed.
Snapshot summary
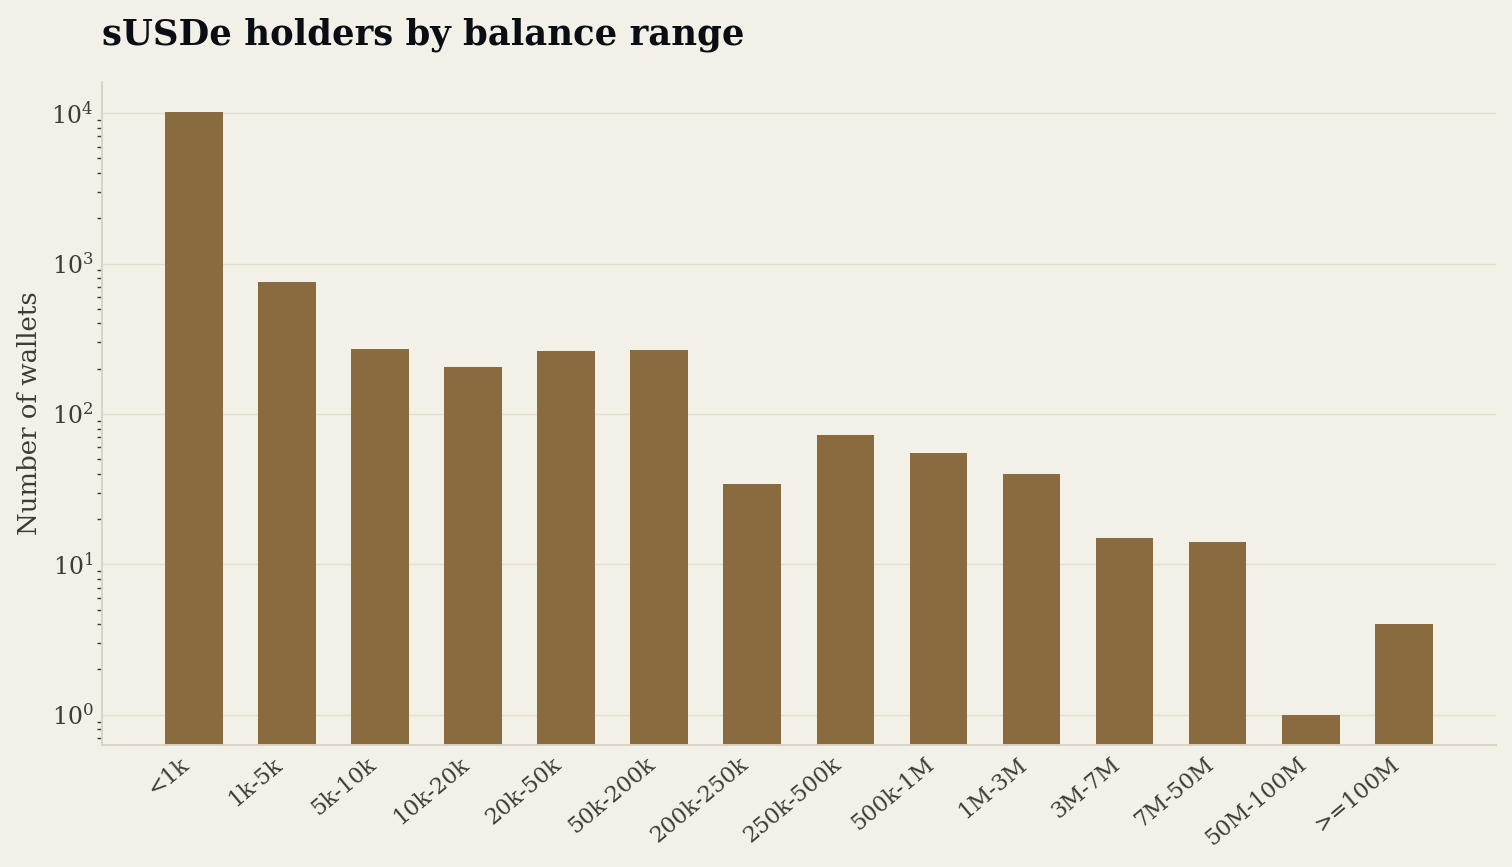
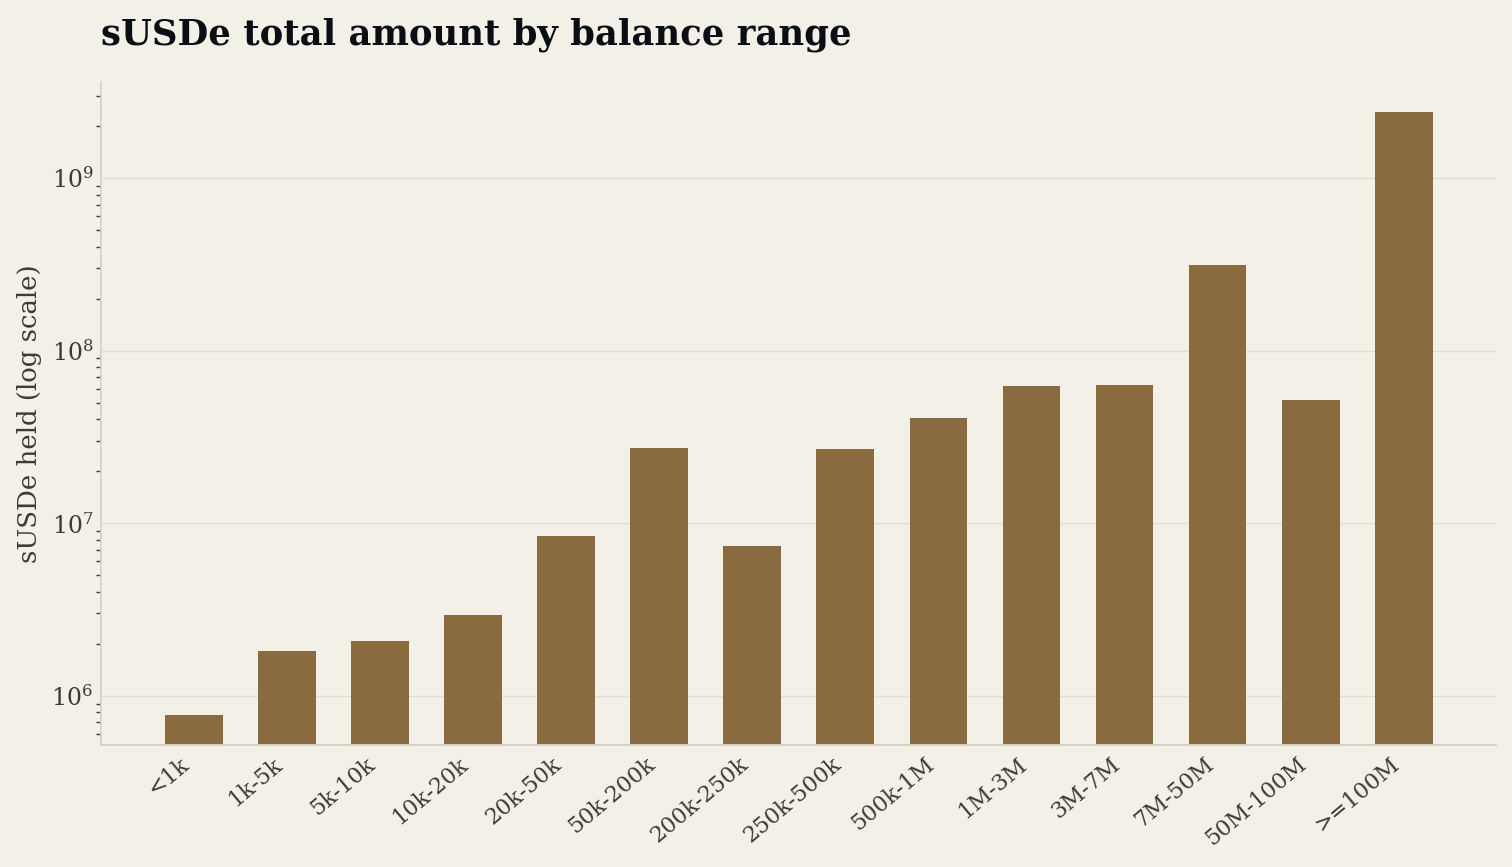
At block 24,413,703, sUSDe total supply was 3,021,477,502 across 12,186 holder addresses. Holder concentration was extreme: the top 10 addresses held 87.79 percent of supply and the top 50 held 95.11 percent, with a Gini coefficient of 0.998. The Nakamoto coefficient, the minimum number of addresses whose combined balance crosses a given supply threshold, was 1 at the 33 percent threshold and 2 at the 50 percent threshold. In plain terms, a single address holds more than a third of all sUSDe, and the top two addresses together hold over half.
sUSDe distribution by balance range
| Range | Share of supply |
|---|---|
| Under 1k | 0.03% |
| 50k to 200k | 0.90% |
| 250k to 500k | 0.89% |
| 500k to 1M | 1.34% |
| 1M to 3M | 2.07% |
| 3M to 7M | 2.10% |
| 7M to 50M | 10.33% |
| 50M to 100M | 1.71% |
| 100M and up | 79.92% |
Ranges with negligible share omitted. Just four addresses holding 100 million sUSDe or more account for 79.92 percent of total supply. The top two addresses alone hold 69.48 percent.
Who actually holds the top balances
A balance snapshot alone cannot distinguish whales from custodial or routing entities. Large balances frequently belong to custody and execution infrastructure such as exchanges, brokers, DeFi routers, and strategy vaults, which can pool many end users into a small set of operational addresses. To test this, we classified the top 300 sUSDe holder addresses as wallets versus contracts and applied heuristic probes to identify common contract shapes, such as Safe style multisigs and ERC4626 vaults.
| Address type | Share of top 300 amount |
|---|---|
| Other contract | 89.55% |
| Wallet (EOA) | 8.31% |
| Multisig like | 2.08% |
| ERC4626 vault | 0.06% |
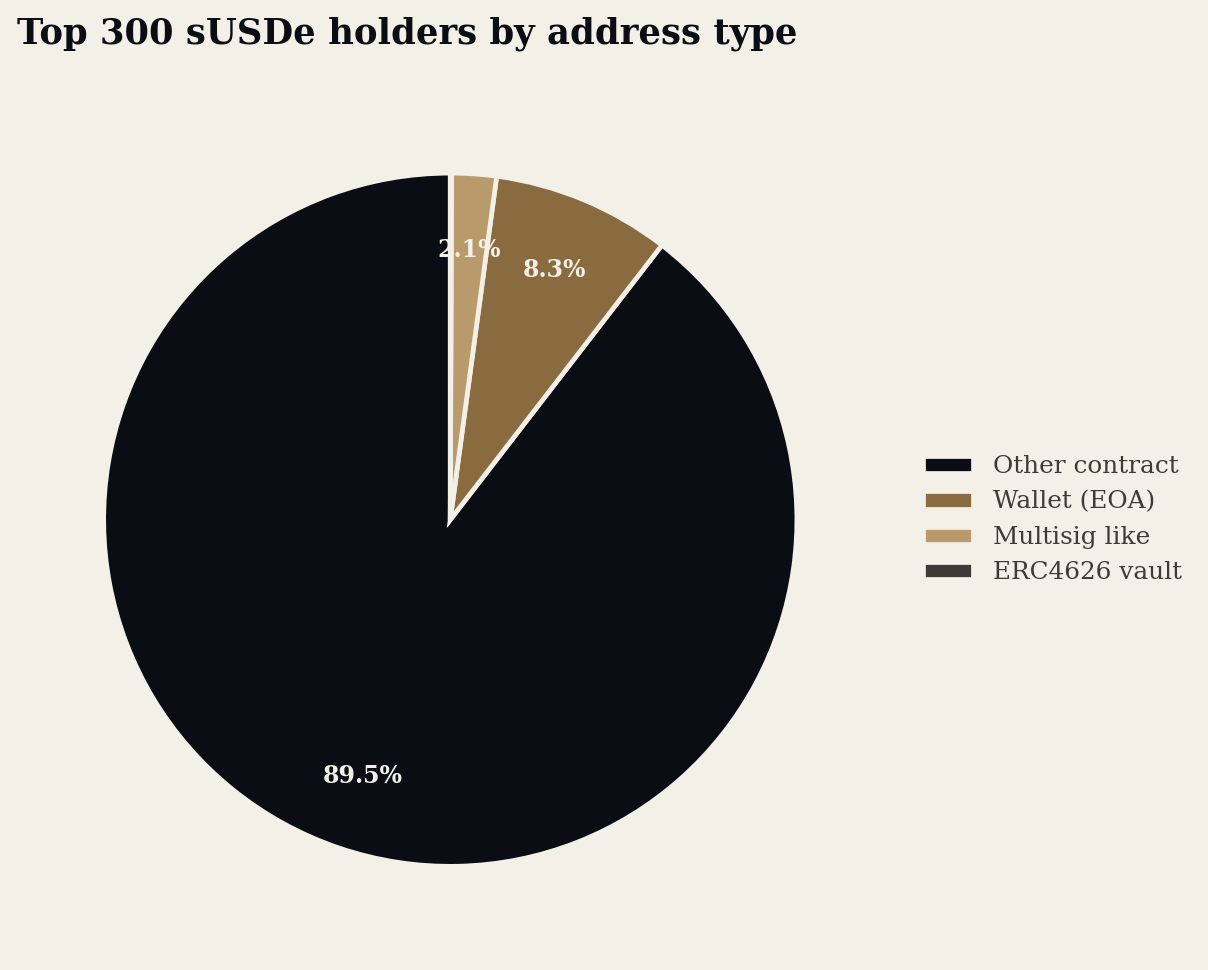
Among the top 300 sUSDe holders, contract accounts hold 91.69 percent of the top 300 amount, while ordinary wallets hold just 8.31 percent. Within that contract mass, the vast majority, 89.55 percent of the top 300 total, sits in generic contracts that do not match a simple multisig or ERC4626 vault interface probe, meaning they are more plausibly custody and routing contracts than additional vault layers. Very little of the top holder mass sits in ERC4626 vault like contracts, which is expected for a receipt token.
This composition is consistent with custody aggregation of sUSDe exposure through intermediaries rather than direct wallet whale dominance. It does not mean retail exposure is absent. Retail and institutional users alike can be intermediated through custodians and execution infrastructure whose addresses then appear as large contract holders onchain. Address type classification is a necessary but not sufficient attribution method: a contract holder could be an exchange hot wallet, a DeFi router, a strategy vault, or a protocol controlled address, and a stronger attribution would require labeled address data and analysis of inbound and outbound transfer counterparties.
Aave v3 stablecoin aToken ownership
Aave v3 deposit positions are represented by interest bearing aTokens. We analyzed holder distribution for aEthUSDT, aEthUSDC, and aEthDAI on Ethereum mainnet, all pinned to block 24,429,915.
| aToken | Holders | Gini | Top 10% | Top 50% |
|---|---|---|---|---|
| aEthUSDT | 19,044 | 0.9794 | 41.56% | 66.48% |
| aEthUSDC | 23,859 | 0.9520 | 23.22% | 40.98% |
| aEthDAI | 2,250 | 0.9701 | 51.51% | 80.26% |
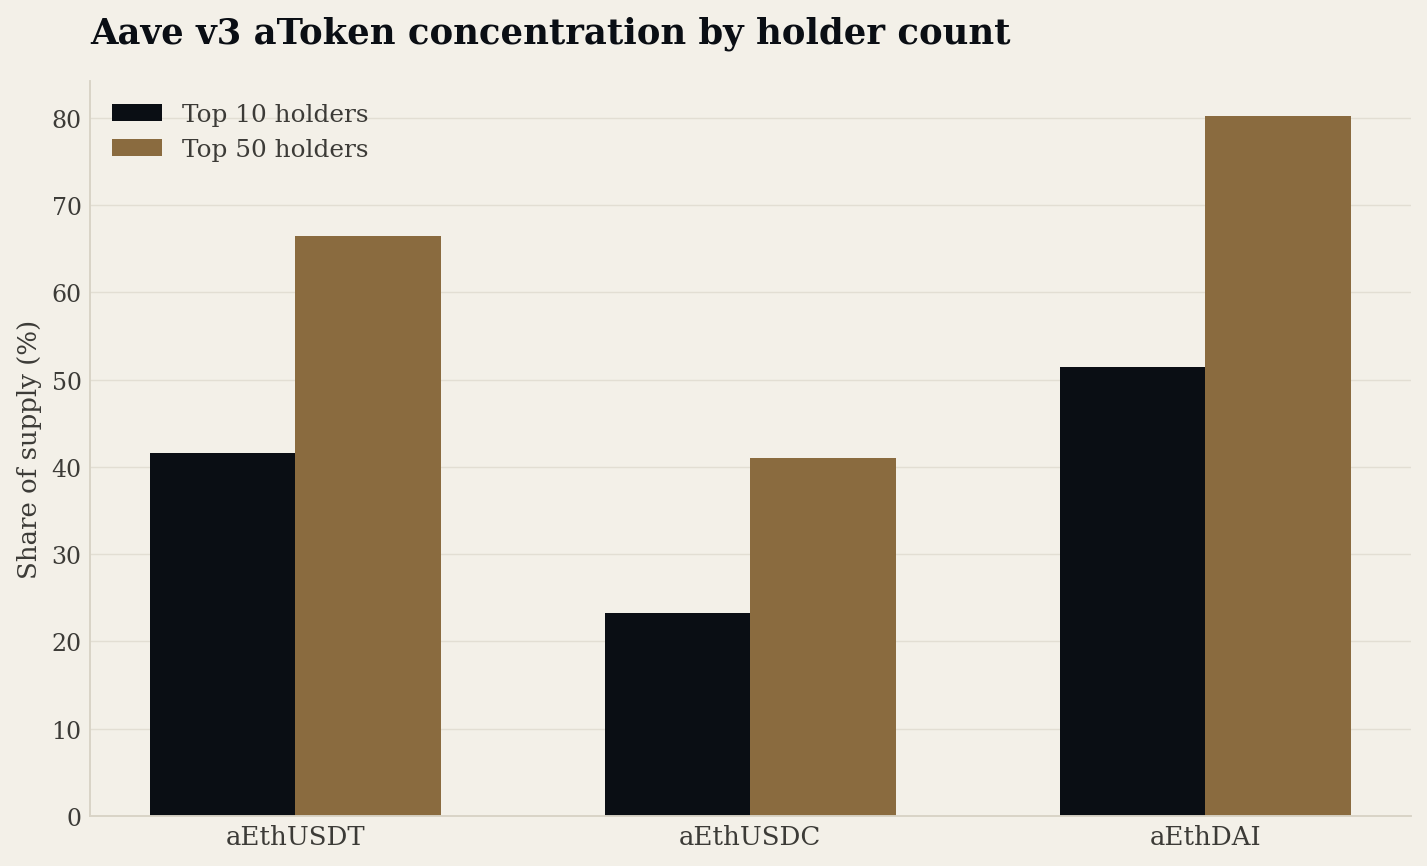
Note: the original report's balance range charts for Aave (Figures 4 through 6) could not be reconstructed, since only their rendered images survived and not the underlying bucket level numbers. The chart above is built instead from the summary statistics table.
Aave v3 aToken ownership concentration, Ethereum block 24,429,915. Reconciliation gaps between holder sum and onchain total supply were non zero across all three assets, ranging from 0.78 to 2.65 percent, so absolute share precision should be read with this measurement gap in mind.
Ownership concentration differs materially across Aave's stablecoin aTokens even within a single protocol. aEthUSDC is the most distributed of the three by both top holder and Nakamoto metrics, with its top 10 holders controlling 23.22 percent of supply across nearly 24,000 holder addresses. aEthDAI is the most concentrated, with its top 10 holders controlling 51.51 percent of a much smaller, 2,250 address holder base. aEthUSDT sits in between at 41.56 percent. The gap between aEthUSDC and aEthDAI illustrates a point that carries through this whole report: concentration is not a fixed property of a protocol, it is a property of each specific asset, product, and its user base.
Conclusion
Across Solstice, Ethena, and Aave v3 stablecoin receipt tokens, address level ownership is strongly right skewed, with a small number of addresses holding a large share of supply. However, concentration at the address level does not uniquely imply that retail participation is absent.
For Solstice, eUSX gives a more direct view of vault exposure distribution, while USX concentration is structurally inflated by vault custody accounts holding backing. For Ethena, sUSDe supply is extremely concentrated and its top holders are predominantly contract accounts, consistent with custody and routing infrastructure rather than individual whales. For Aave v3, concentration varies substantially by aToken, showing that even within a single protocol, different assets can carry very different ownership structures.
Taken together, the data is more consistent with retail being intermediated than with retail being absent. Address level concentration is real and economically meaningful, but interpreting it correctly requires protocol specific knowledge of custody flows and receipt token mechanics, not a mechanical read of who holds what.
Future work
- Standardize windows and sampling. Apply one fixed lookback window, whether a block range or a time interval, for every aggregator diagnostic across every address analyzed.
- Entity clustering and labeling. Cluster addresses likely controlled by the same entity using transfer graph heuristics, and incorporate labeled address datasets to distinguish exchanges, bridges, routers, vaults, and protocol controlled addresses.
- Deposit flow reconstruction. For vault style systems, reconstruct deposits and withdrawals from program logs and events, then compare original deposit distribution to current receipt token distribution.
- Time series dynamics. Repeat these snapshots over time to see whether concentration is rising or falling, and whether new inflows are dominated by large or small addresses.
Questions on the methodology, or a dataset you want run through it? We answer research mail.
amy@sqv3.com